Efficiently debugging and managing your application’s database is crucial for development and troubleshooting. Android Studio offers powerful tools like the Database Inspector that allow developers to inspect, query, and modify databases in real-time while the app runs. This guide walks through how to leverage the Database Inspector effectively, whether you’re working with plain SQLite or libraries built on top of it, such as Room. Mastering these features can significantly streamline your debugging process and improve app stability.
Opening the Database Inspector
To begin inspecting your app’s database, follow these steps:
- Launch your app on an emulator or a physical device that runs API level 26 or higher.
- Navigate to the menu bar, select View > Tool Windows > App Inspection.
- Click on the Database Inspector tab.
- Choose the active process of your app from the list.
- The databases associated with your app will appear in the Databases pane. Expand the node for any database you wish to examine.
This setup allows you to access all the databases your app interacts with, facilitating a thorough understanding of data flow and storage.
Viewing and Modifying Data
The Databases pane displays a list of databases and their respective tables. To examine a specific table:
- Double-click on the table name to view its data in the inspector window.
- You can sort the data by clicking on any column header.
To modify data within a table:
- Double-click on the desired cell.
- Enter the new value.
- Press Enter to confirm.
If your app employs Room with LiveData or Flow, changes made directly via the Database Inspector are instantly reflected in the running app. Otherwise, updates will only be visible after the app reads the data again. For real-time updates, enable the Live updates checkbox at the top of the inspector window. Keep in mind, when live updates are active, the table becomes read-only, preventing manual edits. To manually refresh the data, click the Refresh table button.
Running Queries on Your Databases
The Database Inspector supports executing queries dynamically during app execution. This includes running predefined DAO methods if you are using Room, as well as custom SQL commands.
Executing DAO Queries
For apps utilizing Room, Android Studio provides gutter actions that allow you to run query methods directly. To do this:
- Click the Run SQLite statement in Database Inspector button next to the method’s @Query annotation.
- If multiple databases are present, you’ll be prompted to select the target database.
- For queries with bind parameters, Android Studio will request input for each.
The results are displayed within the inspector, enabling quick validation of database operations.
Interesting:
Running Custom SQL Queries
You can execute arbitrary SQL commands to inspect or modify your data:
- Click Open New Query tab at the top of the Databases pane.
- Choose the database you want to query if multiple are available.
- Enter your SQL statement in the provided text field.
- Click Run to execute.
You can also access your previous queries via the Show query history feature, which allows you to re-run or modify past commands. The results, displayed in the New Query tab, are read-only but support commands like UPDATE, INSERT, and DELETE for data modification. When your app observes database changes through mechanisms like LiveData, modifications are immediately reflected in the app interface.
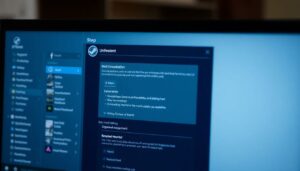
Working in Offline Mode
Starting with Android Studio 4.2, the Database Inspector offers an offline mode that lets you view and query databases even after the connection has been severed—useful after crashes or disconnections. When offline, the databases are downloaded and accessible, but you cannot make edits or run modification queries until reconnected. The process name includes [DETACHED], and the database icon indicates offline status, aiding in identifying the mode. Reconnecting to the live process restores full functionality.
For more common issues related to connection errors, consult guides on resolving graphics device errors on Windows 10 at troubleshooting graphics errors.
Maintaining Persistent Database Connections
The Database Inspector can only modify a database while the app maintains an active connection. Frequent connect/disconnect cycles can hinder debugging. To prevent automatic disconnections, enable Keep database connections open at the top of the Databases pane. This ensures continuous access for debugging and data inspection.
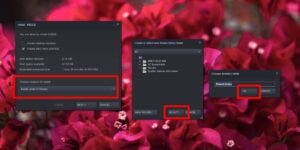
Exporting Data for Backup or Sharing
You can export databases, tables, or query results directly from the Database Inspector:
- Select a database or table and click Export to file.
- Right-click on a database or table and choose Export to file.
- While inspecting data, click Export to file above the query results.
The export dialog supports formats such as DB, SQL, or CSV, enabling flexible data sharing and re-creation. This feature is valuable for documentation, debugging, or migrating data to other environments.
Additional Resources
To deepen your understanding of database inspection and management in Android Studio, explore these official resources:
- Review detailed features in the Android Developer documentation on Database Inspector.
- Learn more about optimizing your gaming setup with tips found in comprehensive guides to gaming on smart TVs.
- For issues related to graphics errors, explore troubleshooting steps in this detailed guide.
- Enhance your app’s performance by exploring beginners’ advice on modding and improving your PC gaming setup.
Mastering these tools and resources will empower you to debug effectively, optimize app performance, and handle database issues with confidence.